Try our Interactive Demos
With Q-Sensei’s analytics platform, hyper-precise searching,
exploring and correlation of billions of data points becomes easy.
See how we add value to data.
With Q-Sensei’s analytics platform, hyper-precise searching,
exploring and correlation of billions of data points becomes easy.
See how we add value to data.
Try our Interactive Demos
With Q-Sensei’s analytics platform, hyper-precise searching, exploring and correlation of billions of data points becomes easy. See how we add value to data.
Use our Query Builder to see value distributions per field
and build complex queries.

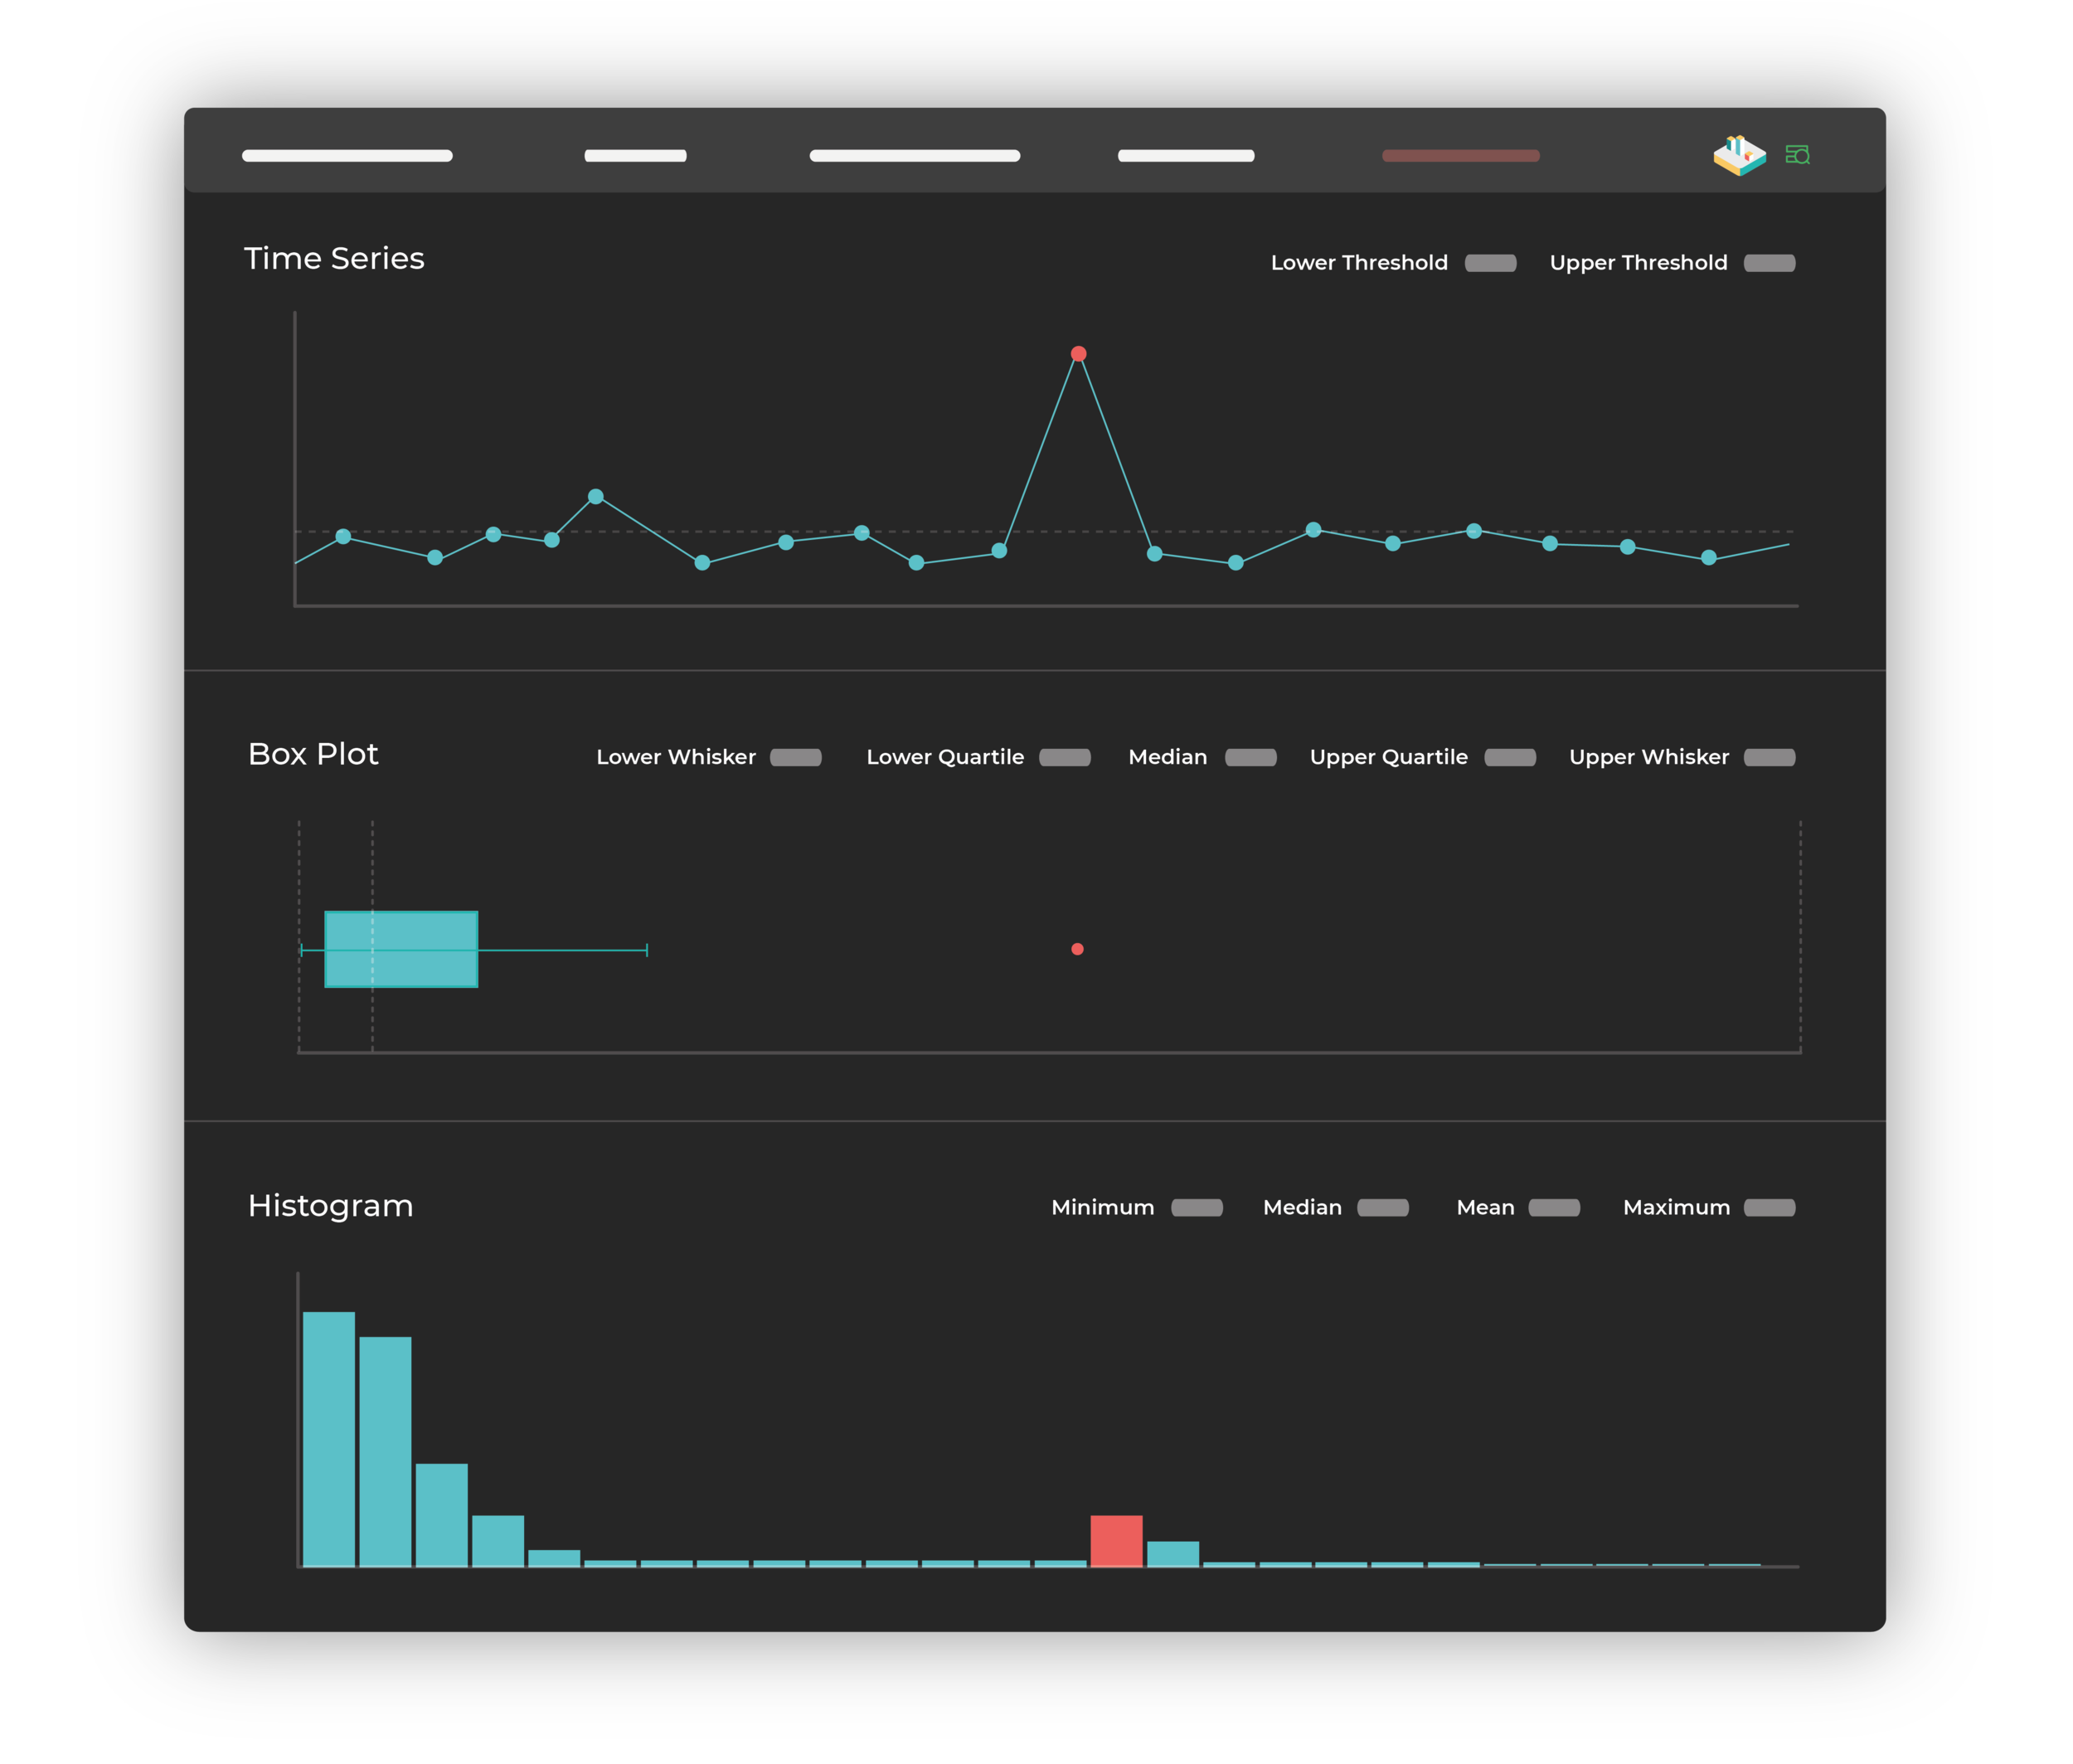
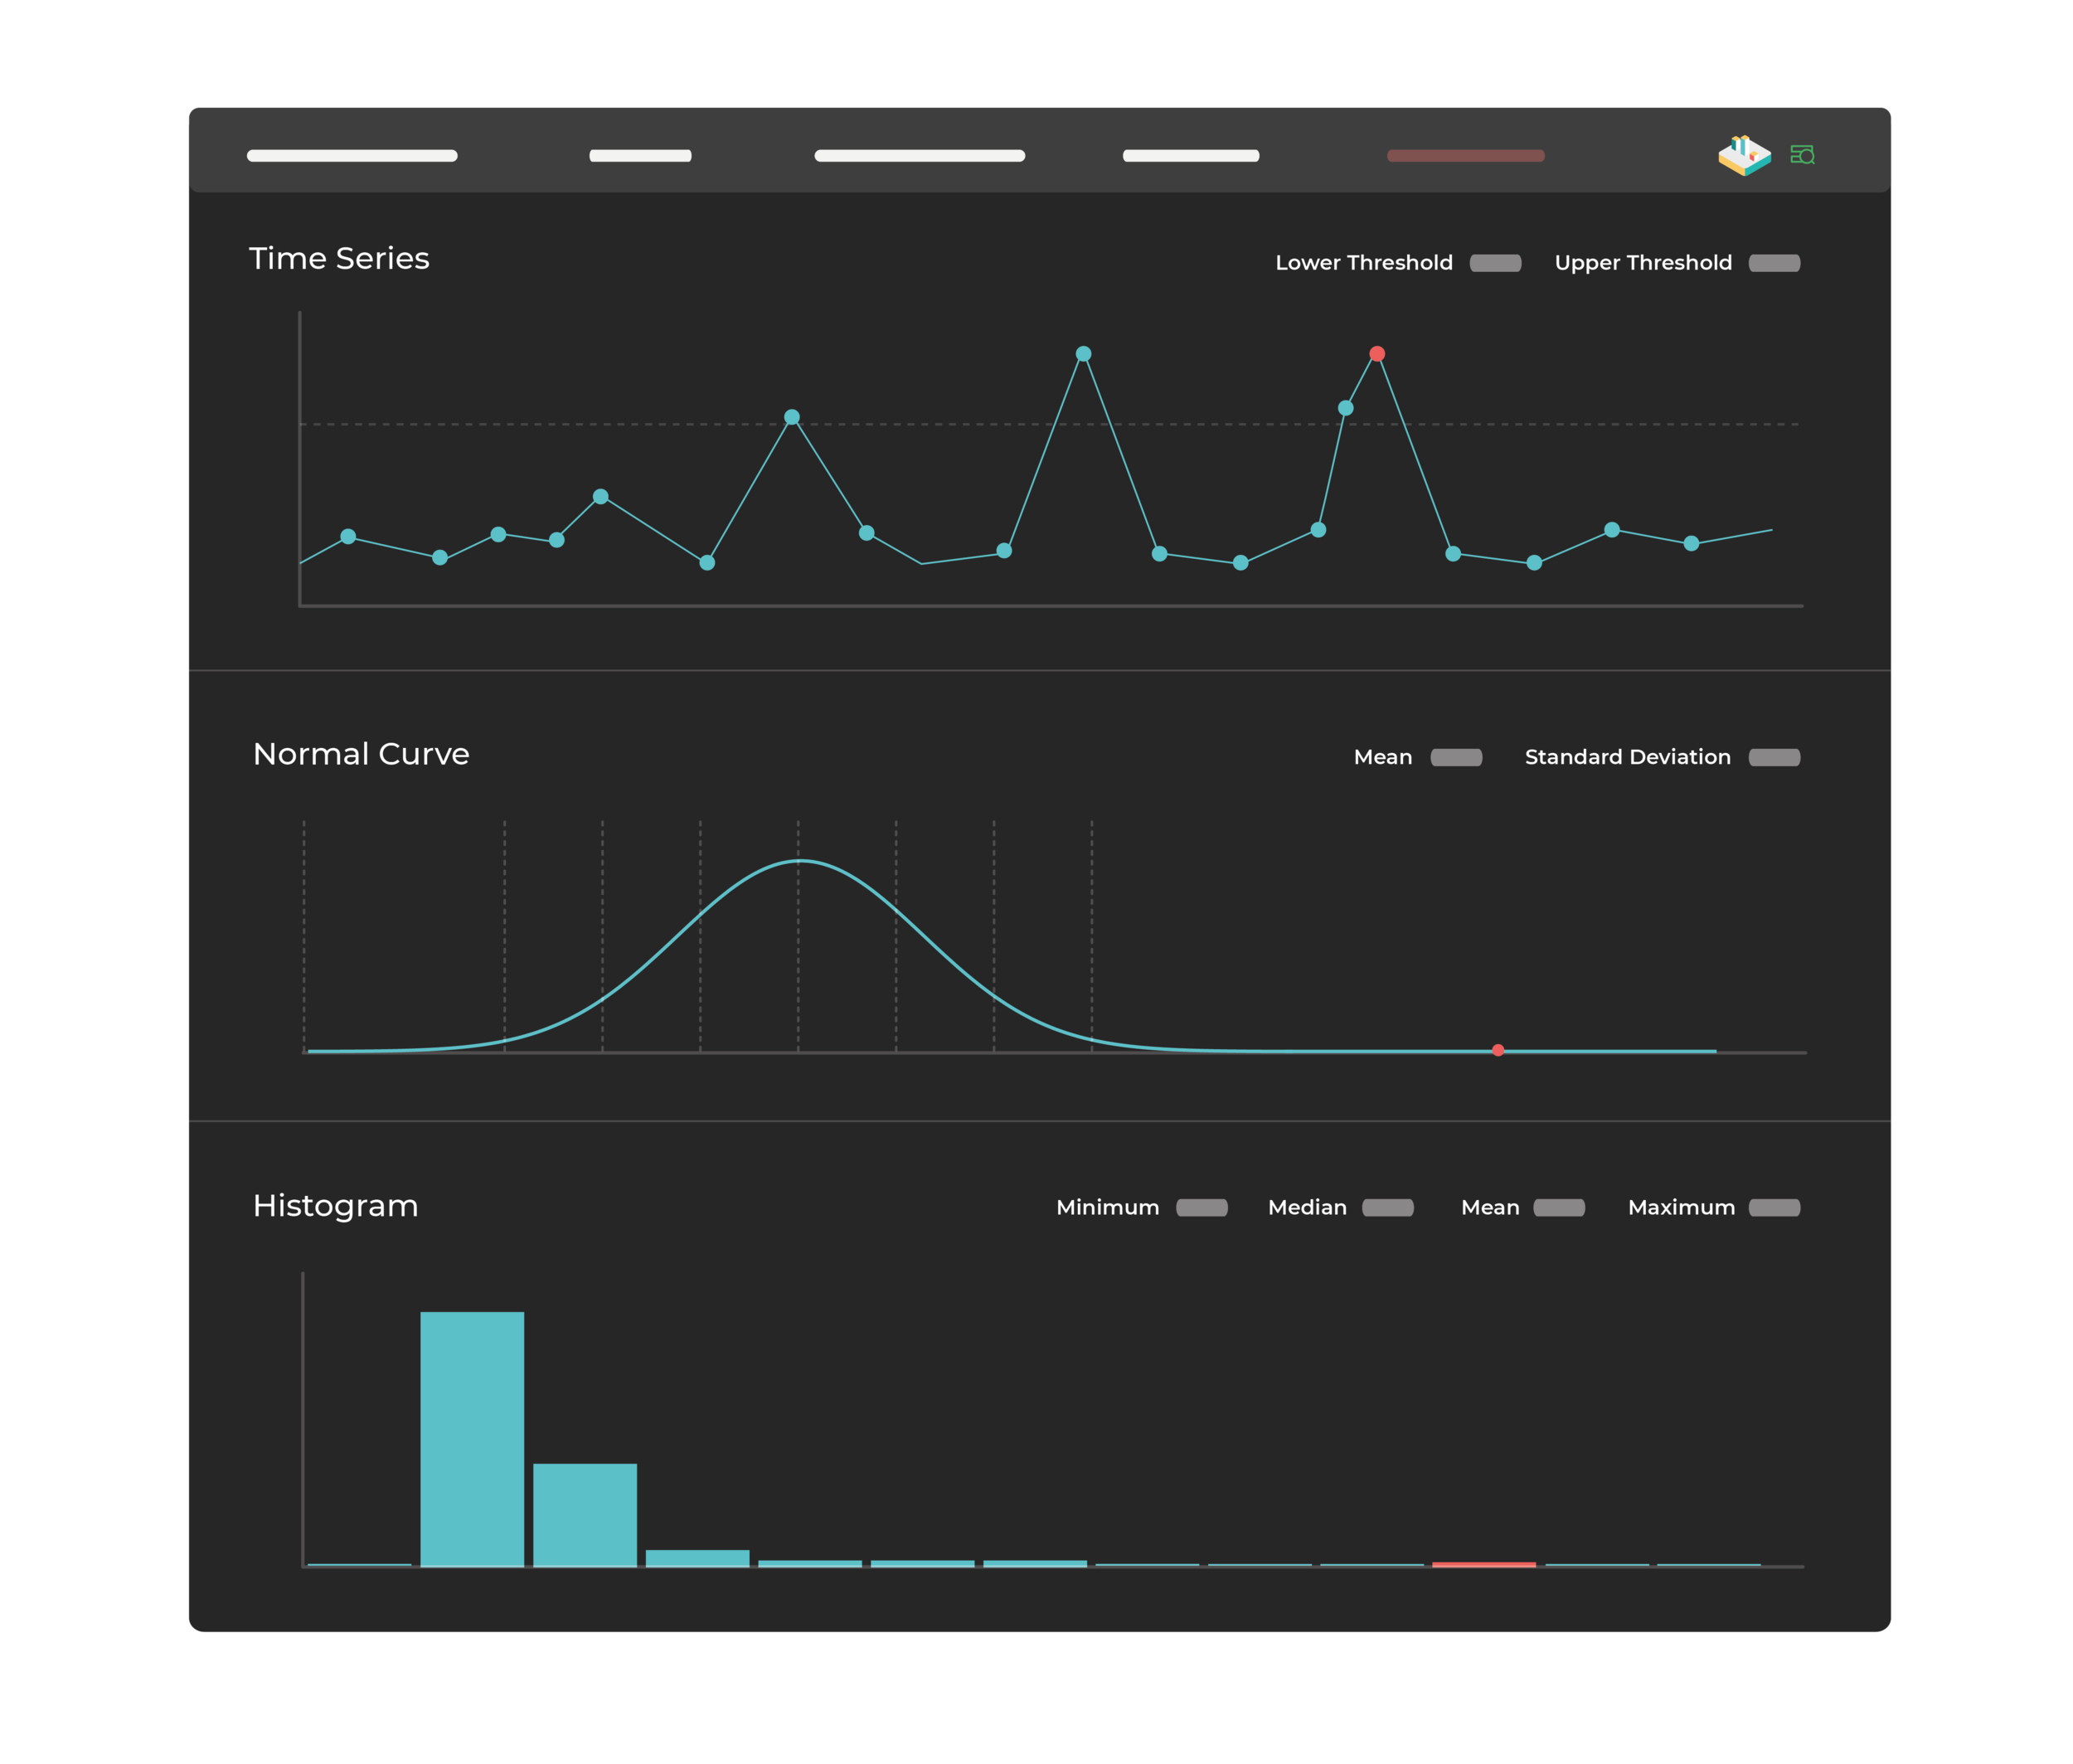
Choose between Standard Deviation, Box Plot, and Random Forest analysis.
Hyper-precise Querying
Use our Query Builder to see value distributions per field
and build complex queries.
Automated Outlier Analysis
Choose between Standard Deviation, Box Plot, and Random Forest analysis.


Example: Amazon SQS

Hardware and Data Metrics

Q-Sensei Logs package (Q-Sensei Logs AWS Listing)
15 MB/day (AWS SQS), 30 days data retention, 260 Facets,
25 million data points
Application Log data
Example: Amazon S3

1 Standard Server (CPU: Intel Xeon E5-1650 v3 @ 3.50GHz (6 physical, 12 logical cores), RAM: 128GB, SSD: 500GB)
282 GB (JSON Format), 47 Facets, 9 billion data points
33 years of US Airlines Performance data from the United States Department of Transportation
See the difference in Analytical Search experiences using Q-Sensei versus Elastic/Kibana: Using the same data and the same hardware, Q-Sensei offers truly interactive Query support, full display of facets and facet values, as well as complex, multi-facet querying at blazing fast speed.
See for
yourself
Examples: Apache Kafka, Amazon SQS
Hardware and Data Metrics
Q-Sensei Logs package (Q-Sensei Logs AWS Listing)
15 MB/day (AWS SQS), 30 days data retention, 70 Facets,
25 million data points
Application Log data
Example: Amazon S3
1 Standard Server (CPU: Intel Xeon E5-1650 v3 @ 3.50GHz (6 physical, 12 logical cores), RAM: 128GB, SSD: 500GB)
282 GB (JSON Format), 47 Facets, 9 billion data points
33 years of US Airlines Performance data from the United States Department of Transportation
See the difference in Analytical Search experiences using Q-Sensei versus Elastic/Kibana: Using the same data and the same hardware, Q-Sensei offers truly interactive Query support, full display of facets and facet values, as well as complex, multi-facet querying at blazing fast speed.
